
Options Analysis Software for Excel
Overview
|
Options Analysis Software for Excel |
|
Overview |
| Custom Spread | Chain | Spread Scanner | Streamer | Testimonials | The Competition | Innovation |
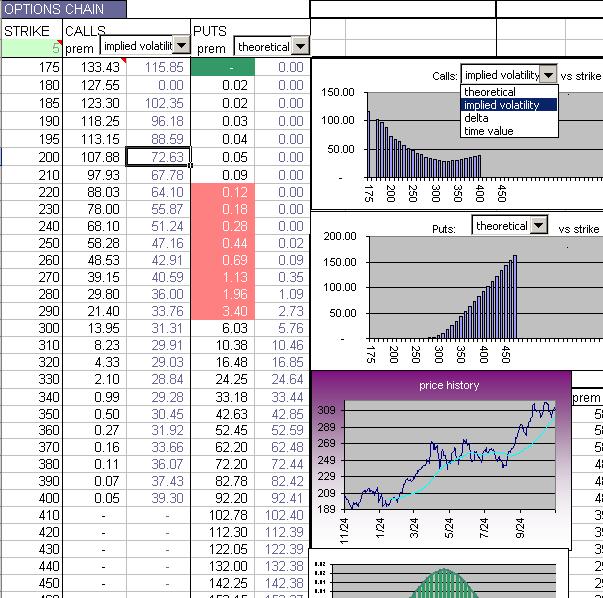
Option Chain Analysis
Optionstar will display and graph
all theoreticals, time value, implied volatilities, and greeks for an Underlying's
Option Chain
Over and Undervalued Options are color hilighted in red and green.
| Copyright 2010 Star Research, Inc. |
| Neither Star Research, Inc. nor Optionstar software
make trading recommendations. None of the charts or information contained in these pages should be construed as a solicitation to trade any of these strategies. In addition, none of the prices contained in the graphs are current. All data is provided solely as theoretical examples for informational purposes. Consult a qualified options broker before assuming a position you are unfamiliar with. There is risk of loss in all trading. |