
Options Analysis Software for Excel
Overview
|
Options Analysis Software for Excel |
|
Overview |
| Custom Spread | Chain | Spread Scanner | Streamer | Testimonials | The Competition | Innovation |
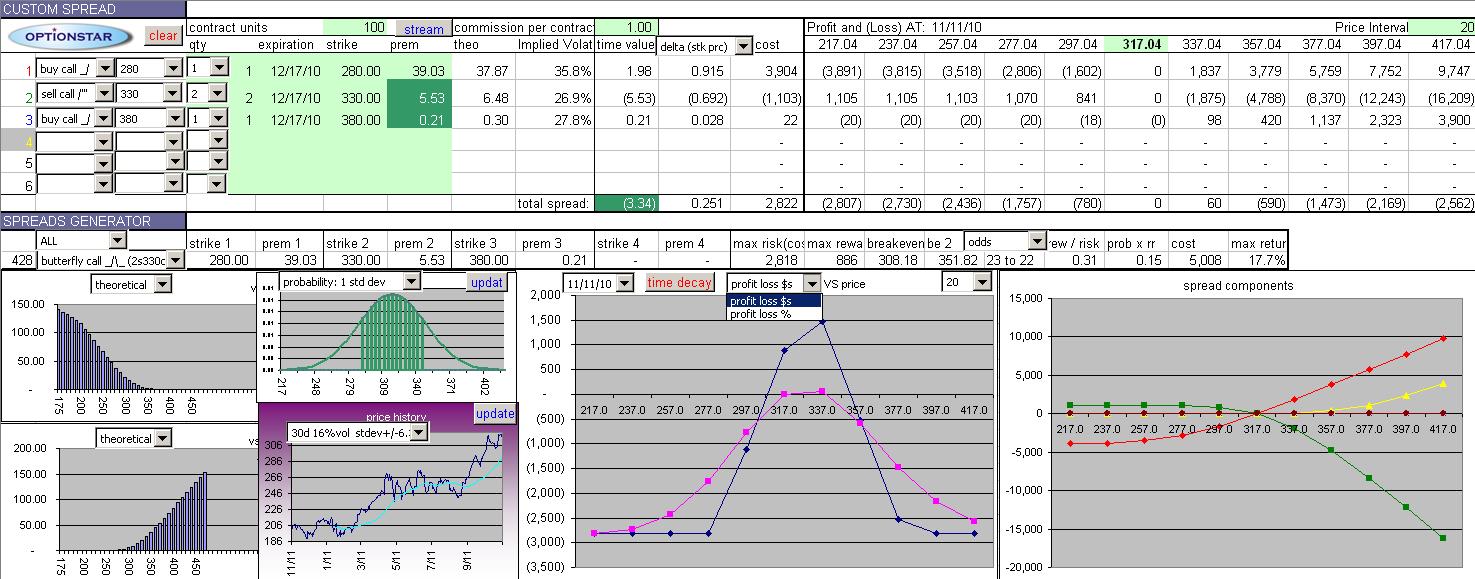
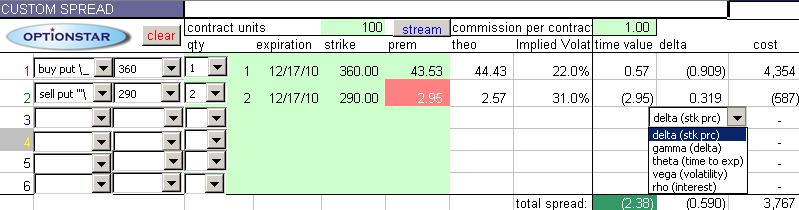
Detailed Custom Spread Analysis
Build or select any custom spread
and Optionstar will instantly display: volatilities, greeks, risk graph,
probability curve, and price history.
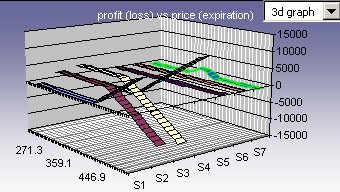
View risk graphs in 3D
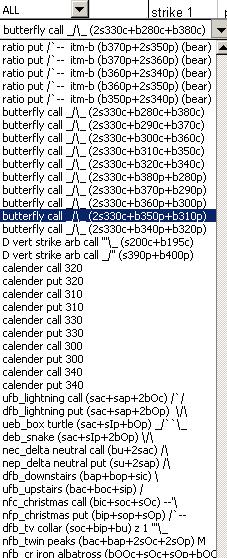
Select from hundreds of pre-generated
spreads with intuitive short hand and risk graph shapes
For example, the selected spread dfb_lightning put (sac+sap+2bOp) /`/
translates to:
dfb (Down, Fair value, Both calls and puts) sac (sell at call)+
(sell at put) + (2 buy Out put) risk graph shape: /`/
Normal distribution probability curve with more detailed plotting and shaded profit zone.
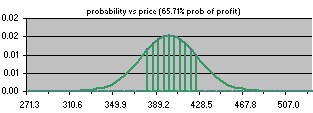
Select from probability OR odds.
Odds represents the gambling payout for example:
25% probability = .25 / (1-.25) odds = .333
= 3 to 1 odds (payout)

All greeks available and totaled:
Dynamic Probability of Profit Chart plotted with break even points OR std deviation from the mean.
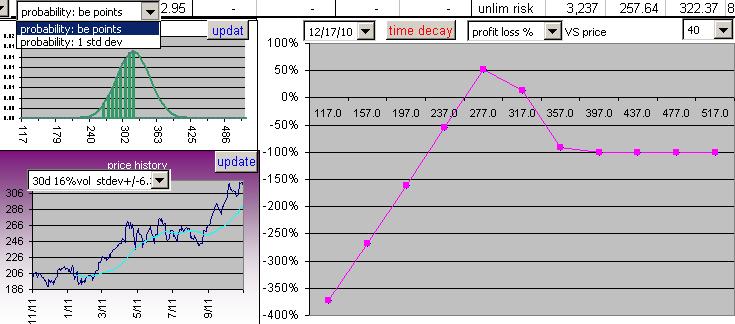
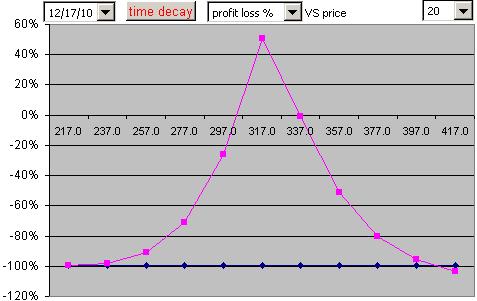
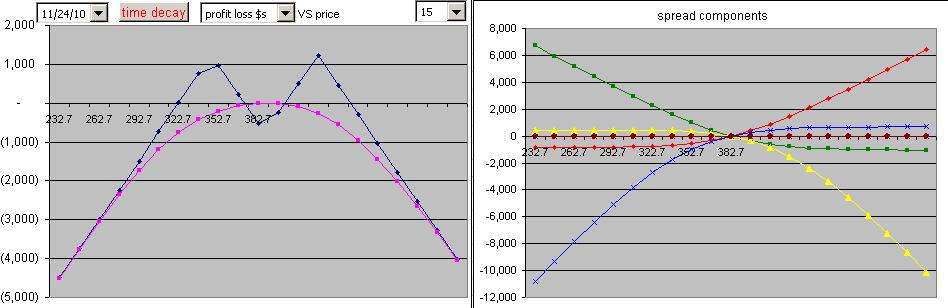
View Time Decay:

Advanced calendar spread analysis
and risk graphs. Be able to graph the profit loss vs price of
diagonal and regular calendar spreads with two different expirations.

Risk graphs also plotted by % return
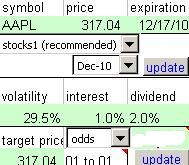
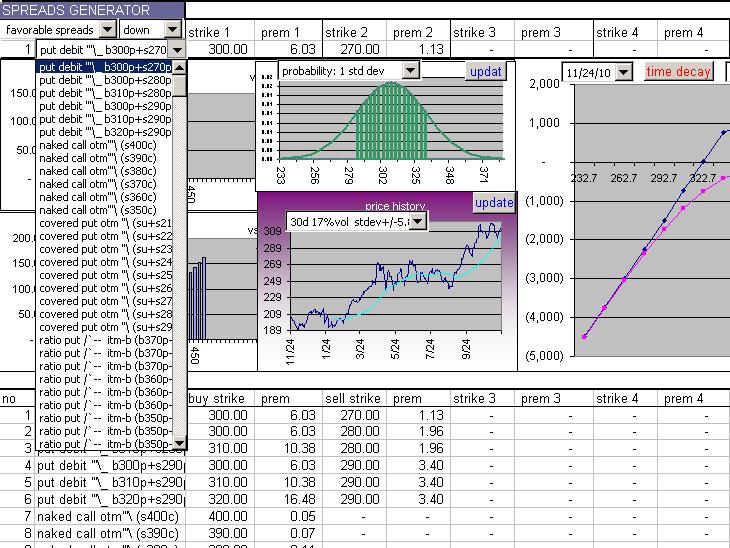
Recommended Spreads based on the
direction you think the underlying is headed.
Optionstar will automatically generate the spreads most favorable for the
current valuation
of the at the money calls and puts. Below, the at the money calls and puts
are shown to be expensive compared to their theoreticals.
The selected direction is Down so Optionstar will generate bearish spreads that
mostly have sell options.
Higher definition Risk Graphs:
Optionstar will plot Risk Graphs up to 21 plots.
| Copyright 2022 Star Research, Inc. |
| Neither Star Research, Inc. nor Optionstar software
make trading recommendations. None of the charts or information contained in these pages should be construed as a solicitation to trade any of these strategies. In addition, none of the prices contained in the graphs are current. All data is provided solely as theoretical examples for informational purposes. Consult a qualified options broker before assuming a position you are unfamiliar with. There is risk of loss in all trading. |