
Options Analysis Software for Excel
Education: Option Spread Short Hand
|
Options Analysis Software for Excel |
|
Education: Option Spread Short Hand |
| Custom Spread | Chain | Spread Scanner | Streamer | Testimonials | The Competition | Innovation |
Option Spread Shorthand
by Jesse Chen
With all the hundreds of different option
spreads types to sort through, a nice
system of quickly identifying and
classifying them would be useful.
A shorthand system has been made up for
describing the spread legs and
market conditions.
SPREAD LEGS SHORTHAND
I have developed an abbreviation system
for to describe each option in a spread.
Option strategies:
bc = buy call sc = sell call
bp = buy put sp = sell put
bu = buy underlying su = sell underlying
Option strike prices:
a = at the money (calls: strike = underlying, puts: strike = underlying)
i = in the money (calls: strike < underlying, puts: strike > underlying)
o = out of the money (calls: strike > underlying, puts: strike < underlying)
<i = slightly in the money, I = in the money, II = deep in the money>
<o = slightly out of the money, O = out of the money, OO = way out of the money>
Examples:
1. vert call-s (boc+sOc) '''\_
(buy slight out call + buy out call)
2. ratioP4 (2sap+bIp) /`--
(buy 2 at the money puts + buy in the money put)
3. butterfly (sac+sap+booc+boop) _/\_
(sell at the money call + sell at the money put + buy out of the money call
+ buy out of the money put)
4. conversion short (sp+bc+su) z ----
(sell put + buy call + sell underlying)
MARKET CONDITIONS SHORTHAND
There are three major conditions
which influence option spreads.
1. DIRECTION OF UNDERLYING: the direction of the underlying
that be most profitable for the spread.
(There are four directions: Up, Down, Neutral, or Choppy)
2. VALUATION OF OPTIONS: spread option values compared to the theorecticals
that would be most profitable for the spread.
(There are three option valuations: Expensive, Fair, and Cheap)
3. TYPE: spread option types: Calls, Puts, or Both
Given these three conditions,
I have developed a three character system to describe
the best conditions for any spread.
Lets start out with a simple spread to illustrate this.
dfc_vertical call (boc+soc) '''\_
dfc: down (underlying direction) fair (option valuations) c(calls)
this spread will be most profitable in the following mkt conditions:
Down underlying, Fair option valuations
this spread uses Call options
neb_butterflyCP4 (sac+sap+booc+boop) _/\_
neb: neutral (underlying direction) expensive calls and puts
nfb_conv-s (sp+bc+su) z ----
nfb: neutral (underlying direction) fair calls and puts
ccb_strangle (boc+bop) \_/
ccb: choppy (underlying direction) fair calls and puts
dep_covered put (su+sap) '''\
dep: down (underlying direction) expensive puts
uec_vert c [mid-prob, mid-rr] (biic+sac) _/'''
uec: up (underlying direction) expensive calls
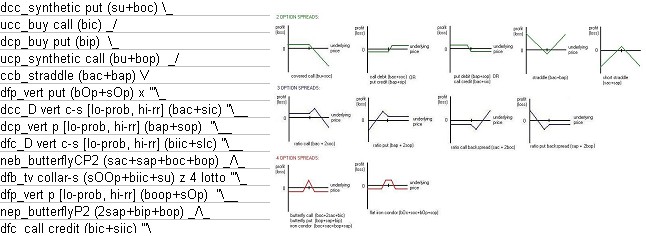
RISK GRAPH SHAPES IN TEXT
The final shorthand that can be used will visually illustrate the
shape of the risk (profit loss vs underlying price) graph for the spread.
The standard common spread strategies look as follows:
bc = buy call _/ sc = sell call ''\
bp = buy put \_ sp = sell put /''
bu = buy underlying / su = sell underlying \
other common spread risk graph shapes:
bull spread _/'' bear spread ''\_
straddle \/ short straddle /\ strangle /''\ short strangle \_/
butterfly _/\_ conversion ---
ratio call backspread --,/ ratio put backspread \,--
ratio call --^\ ratio put /`--
As shown, this shorthand can be a quick and useful way in identifying
the best most profitable spreads based on underlying direction, and
current option valuations.
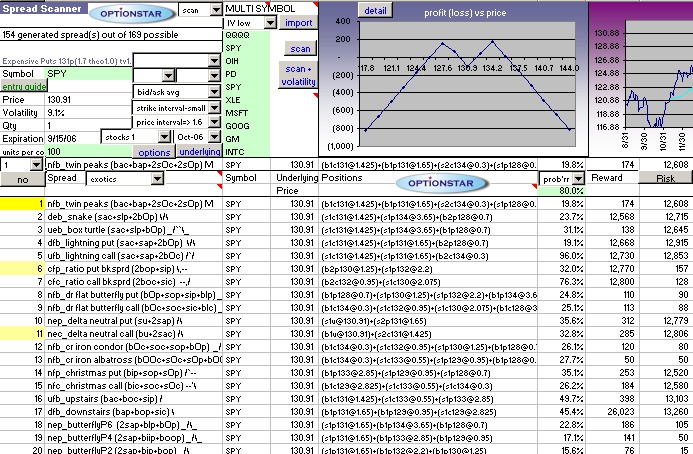
OptionStar options analysis software uses this shorthand system
to organize the hundreds of spreads it can build.
As seen below, all spreads use this shorthand, one per line.
| Copyright 2006 Star Research, Inc. |
| Neither Star Research, Inc. nor Optionstar software
make trading recommendations. None of the charts or information contained in these pages should be construed as a solicitation to trade any of these strategies. In addition, none of the prices contained in the graphs are current. All data is provided solely as theoretical examples for informational purposes. Consult a qualified options broker before assuming a position you are unfamiliar with. There is risk of loss in all trading. |